A rare winter storm in Texas from Feb. 2 to 5, 2011 brought the state to a freezing halt. Ice storms paralyzed airports and freeways. Schools were closed for a week. For the second time in two decades there were statewide rolling blackouts, leaving more than one million households in the frigid dark for more than an hour at a time. Even the state’s whopping plans for the party of the year at Super Bowl XLV on Feb. 6 in Arlington were put on ice.
Weather-related outages caused hourly wholesale power prices in Texas to soar 60-fold to $3,000 per megawatt-hour, up from about $50 where they usually trade. Wholesale power for Feb. 3 traded as high as $500, up from about $70 for Feb. 2 as expectations for cold rolled into Feb. 4.
"This was a very rare and severe event," said Steve Bennett, chief science and products officer of EarthRisk Technologies. "Winter storms in North Texas are not unusual, but this event exceeded our ColdRisk Threshold (a proprietary measure of extreme cold) by nearly 10-degrees. That’s only happened six times since 1948."
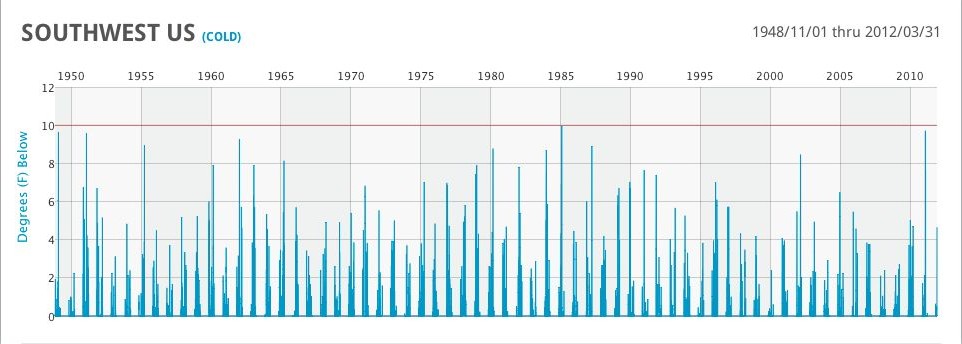 Figure 1 : Historical severe cold events since 1948 show only six incidents of temperatures between 9 and 10 degrees colder than the severe cold threshold. In fact, February 2011 marked the second strongest ColdRisk event in the region's 63-year history, second only to the 1985 ColdRisk event.
TempRisk customers saw a threat coming. In fact, they saw signals for a ColdRisk event in Texas and the surrounding region as early as the first week of January -- nearly 30 days prior to the event.
The TempRisk Matrix on Jan. 5 showed a relatively weak but persistent signal (across many initialization days) indicating a 30 to 40 percent probability that a ColdRisk event would occur in early February. This is a significant signal when compared against the climatology of that specific region (25%). TempRisk showed that the atmosphere was setting up for a severe cold outbreak; ColdRisk events have followed this particular set of atmospheric patterns about one month later at a rate of 30-40% of the time since 1948.
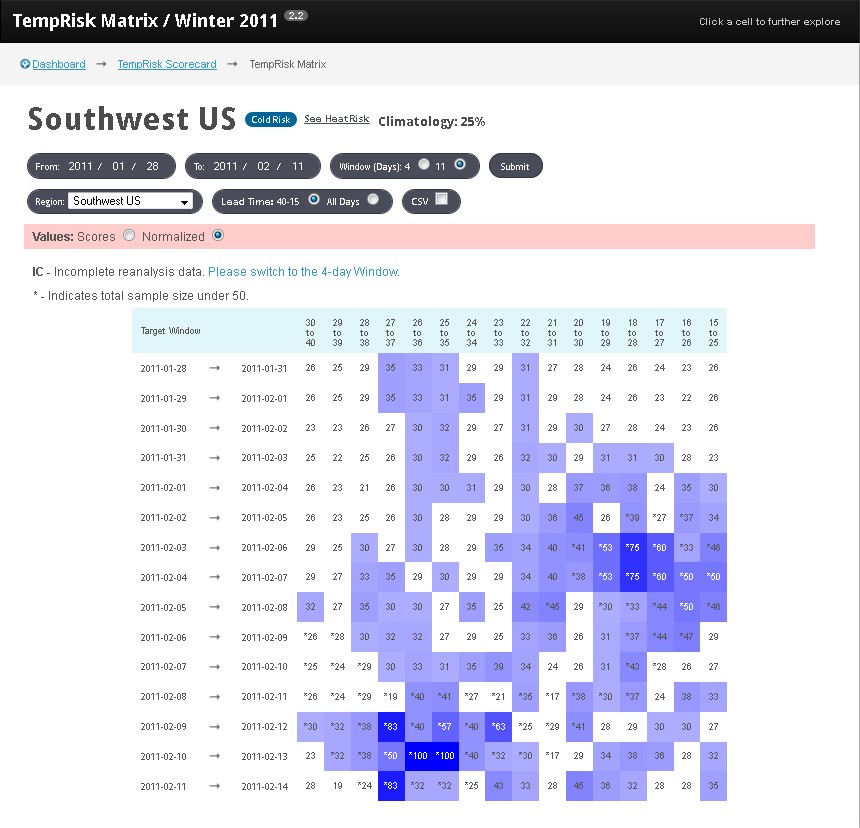 Figure 2 : The ColdRisk 11-day matrix from Jan. 5 indicates a higher than 30-40 percent chance of a cold event from Jan. 31 to Feb 13.
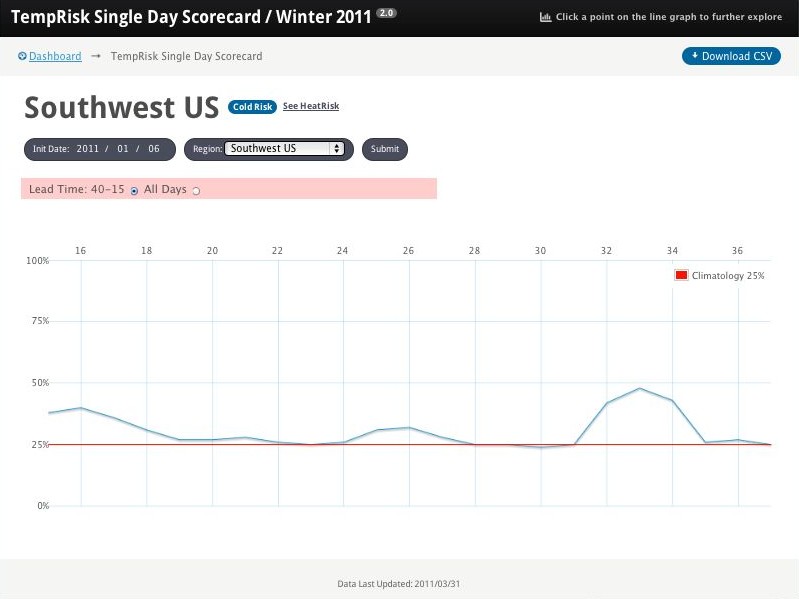 Figure 3 : The TempRisk Single Day Scorecard for Jan. 6 shows nearly 50 percent probability of a cold event 30 days ahead, on or targeted around Feb. 4.
TempRisk’s Single Day Scorecard from Jan. 5 and Jan. 6 showed that the more recent atmospheric pattern (those observed on Jan. 5 and Jan. 6 individually) was up near 50%. By Jan. 8, the Single Day Scorecard jumped from near 50 up to 100 – the maximum possible signal. This jump told TempRisk customers that a very rare atmospheric pattern was evolving that, when compared to historic patterns, has always led to severe cold in Texas and the surrounding region.
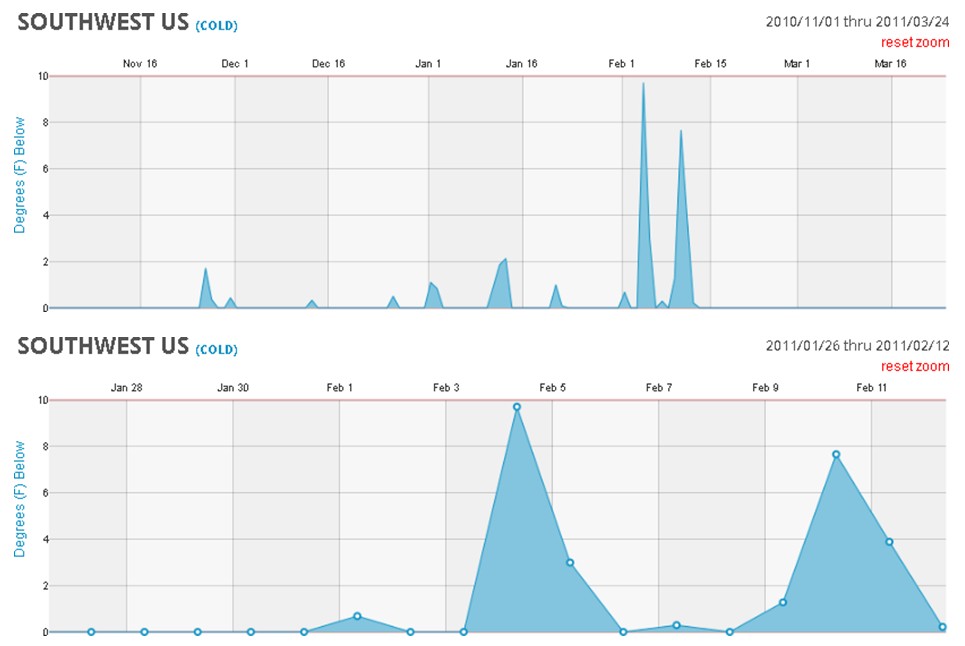 Figure 4 : The ColdRisk Index (an EarthRisk measure of severe cold for a region) demonstrates the severity of the cold witnessed on Feb. 4 in Texas and the surrounding region. Temperatures were nearly 10-degrees colder than the ColdRisk threshold. The National Weather Service reported that low temperatures on Feb. 4 dropped to 23 degrees in Houston and 19 degrees in Dallas.
 Figure 5 : The TempRisk Matrix from Jan. 8, showed several strong signals including a maximum risk for severe cold in the first half of Feb.
The dramatic TempRisk signals were driven by a rare combination of meteorological phenomena that are statistically related to strong cold surges in the Texas region. First, a strong area of high pressure pushed southward across Asia accompanied by an area of low pressure in the western Pacific. This coincided with an unusual dipole of warm and cold temperatures in the stratosphere. Meteorologists call this a “stratospheric-warming event” and it was observed across northern Asia alongside a strong stratospheric cold event in Canada.
"We know that stratospheric warming events like the one in Asia are often followed by severe cold in the United States but the combined 'warm/cold' pattern in the stratosphere along with that surface pressure pattern in Asia hasn’t happened very often," Bennett said.
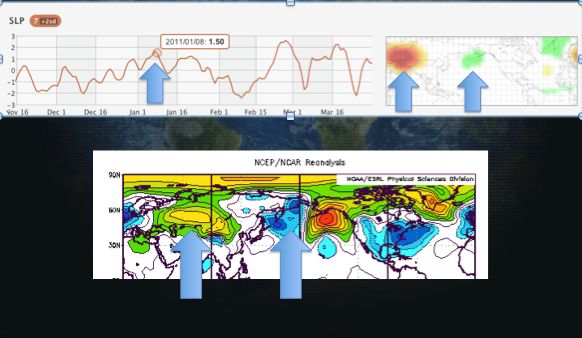 Figure 6 : NCEP/NCAR Reanalysis (bottom map) indicates a high pressure center at the surface over Asia, and low pressure center at the surface over the west Pacific. This pattern was observed at 1.5 standard deviation on Jan. 8, 2011 (top chart).
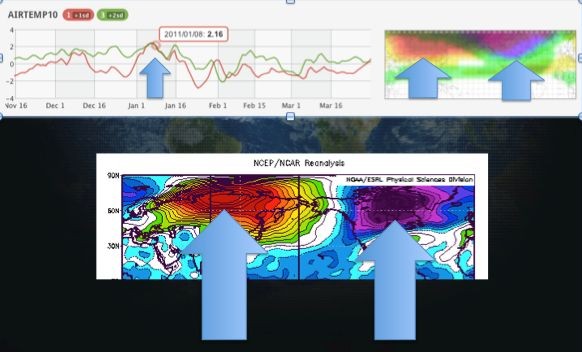 Figure 7 : NCEP/NCAR Reanalysis (bottom map) indicates a strong stratospheric warming event over Asia and a strong stratospheric cooling event over northern Canada. Each of these patterns (separately) was observed over 2 standard deviations on Jan. 8, 2011 (top chart).
While the February 2011 cold event in Texas was well predicted by most weather forecasters within about 10 days of developing, only TempRisk customers saw the numbers. TempRisk’s objective output clearly demonstrated the specific historic relationships leading to the conclusion that there was a high risk for an extreme event nearly 30 days before it occurred. This is vital information for groups who buy energy futures, manage power plants, contract natural gas or, in this case, had plans for tailgating prior to the Super Bowl!