On July 22nd the East US experienced a record breaking HeatRisk event. Through the use of TempRisk we were able to identify this record-breaking event nearly 30 days before it happened. This unprecedented lead-time is made possible by the catalog of signals housed in TempRisk. Customers of TempRisk use signals that have daily proprietary values to determine increased HeatRisk according to regions that they are subscribed to.
The first signal of the July event to be identified developed on June 21st in the 27-30 lead-time. This TempRisk signal emphasized the 18th to 21st of July as a target for the HeatRisk event to occur. This signal was representative of high pressure over Greenland and became the first in a series of signals. Following shortly after the first, was a signal indicating significant trade winds and then another tied to a strong increase in mid-troposphere pressure.
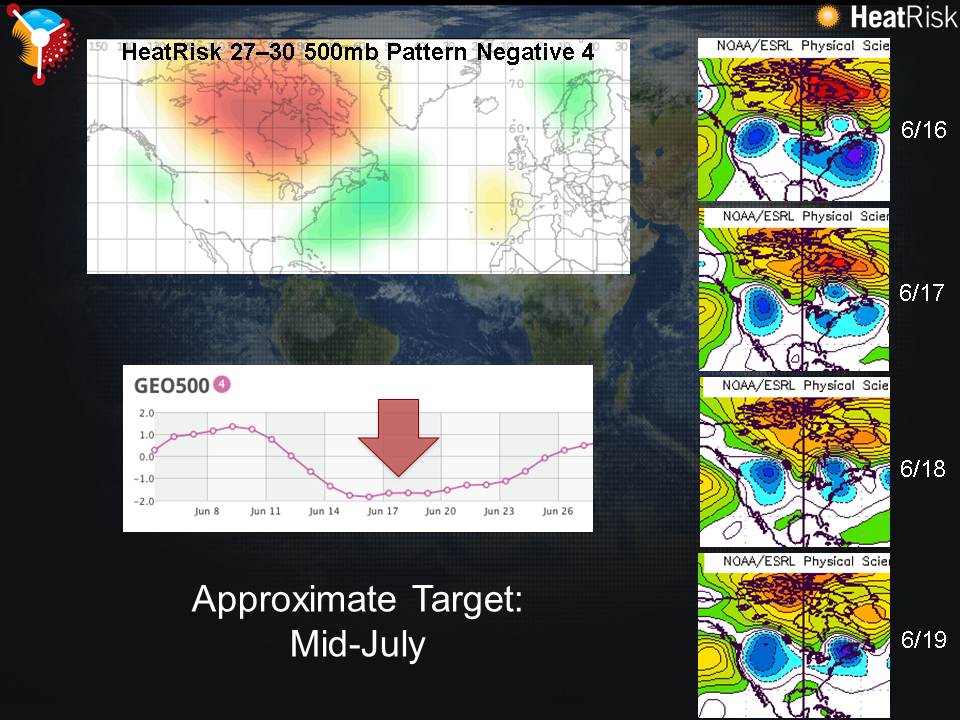 Figure 1 Initial mid July signal
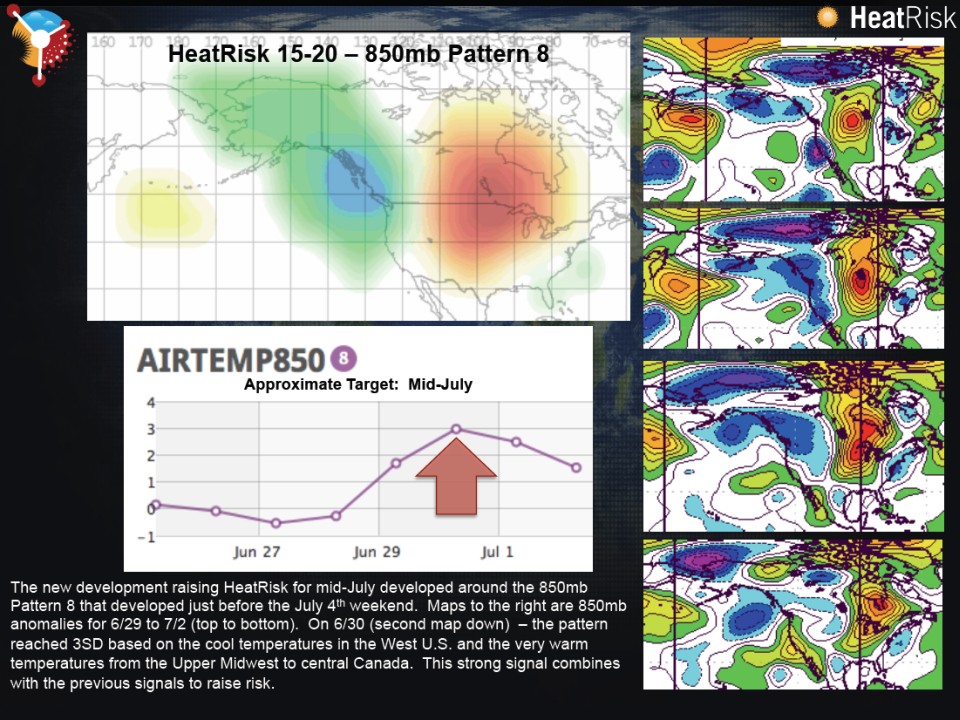 Figure 2 850mb signal
This first group of TempRisk signals was pivotal in building awareness to an upcoming HeatRisk event. In this case a second group of signals are what build user confidence to take action.
Beginning the second set, at a lead-time of 15-20 days, a signal developed made up of high temperatures over central Canada through the Upper Midwest and low temperatures on the West coast of the Pacific Northwest. This was to be historically the 3rd strongest signal representing that specific weather pattern ever seen. The final signal in that set was another mid-troposphere pressure pattern. This pattern located over the Arctic Circle was part of the strongest ridge of high pressure ever recorded (see Figure3).
Identified on July 6th and lasting through 8th, the progression of signals would have been followed for more than two weeks by customers all identifying mid July for what would become a major HeatRisk event.
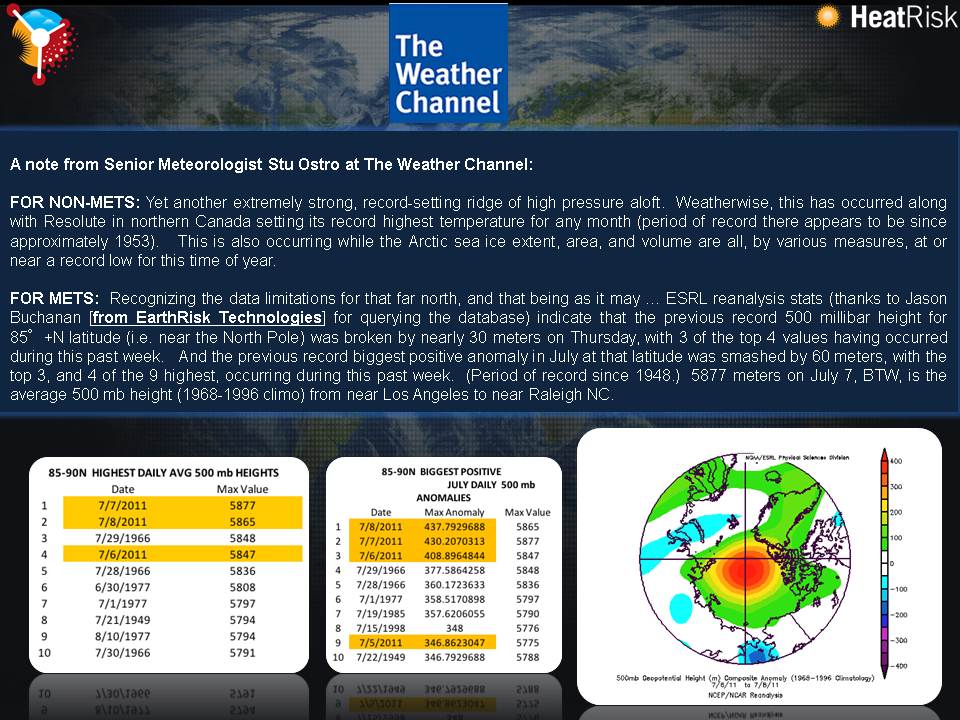 Figure 3 500mb pattern breaks records